

TED
TED Score quantifies the performance of actions, processes, and projects. Ultimately, it provides a framework to assess client satisfaction by measuring Timeliness, Efficiency, and Deliverables, and is applicable to internal and external clients. TED Score does not quantify quality because that attribute is inherent to the specification, and it is incumbent upon the producer (vendor, consultant, employee, etc.) to ensure that the product/service meets the excellence demanded by the consumer (client, customer, shareholder, etc.).
Risk management is also the sole responsibility of the producer and not a TED Score dimension. Although the consumer may be sympathetic and accommodating, in general there is no interest in the obstacles encountered along the way in the production of the Deliverables, as long as the end result complies with the specification. Although TED Score is an indicator of performance, the true objective is to ensure that producers build solid business relationships with consumers. Viewing the progression and completion of a project from the consumer’s perspective, emphasizes Consumer Satisfaction, an often overlooked aspect in business transactions.
Model Expressions
The Simple TED Score expression for a standalone unit (project, process, action) is as follows:
((1-AT/PT)WT)+((1-AE/PE)WE)+((AD/PD-1)WD)
Figure 1: Unit Simple TED Score
The Composite TED Score expression reveals the impact of a Child Unit in a Parent/Child relationship, and provides a granular view of the smallest unit.
(((1-AT/PT)WT)((PT/ParPT)ParWT))+(((1-AE/PE)WE)((PE/ParPE)ParWE))+(((AD/PD-1)WD)((PD/ParPD)ParWD))
Figure 2: Composite TED Score with Child Units
The Composite TED Score of each child unit reflects itself on the parent’s TED Score, and highlights the importance of the smallest unit’s performance from the consumer’s standpoint. Ultimately, every process is a child of a parent project, and every project is a child of a business unit. It is possible to calculate the TED Score of an organization as the composite value of its business units and every underlying project, process, and action.
T&E Progress Is Opposite D
In traditional project measurement, the three dimensions have the same origin and progress in the same general direction. Under this approach, producers always view the end result as a positive number, even though the dimension can indicate a project that is over budget or behind schedule. From the consumer’s perspective, the picture is very different, and the TED Score is based on the premise that Deliverables progress opposite Efficiency and Timeliness (Figure 3).
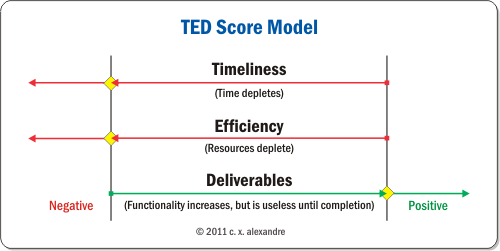
As the Deliverables are built, Resources and Time are depleted. Half way through a project, the standard view is that “we still have half the money and half the time to complete the project.” Although it may look like semantics, TED Score’s position highlights a different mind-set and states that “we only have half the money and half the time to complete the project.” Although the producer sees the Deliverables progressing, the consumer has a different perception. Half way through a project, the consumer only knows that half the money and half the time are spent, and that a solution is not yet in place. If the project stalls and meets an untimely death, recovering resources and time is impossible and the impact on operations may be disruptive.
If project resources and/or time are exhausted, the project enters a negative utilization phase. The connotation of the word “negative” is a better indicator of the project status than the word “over,” as in “over budget.” Thus the importance to view the progression as depicted in Figure 3 is to instill a sense of accountability and responsibility about any action, process, or project.
Model Metrics
The TED Score for a unit starts at zero (0). At the beginning stage, the consumer only knows that a commitment is made to build a product or deliver a service as specified, for an agreed price, and within an established timeframe. When the project is complete to the consumer’s satisfaction, the TED Score is zero again, indicating that an even exchange took place. The consumer received the product/service and the producer was compensated for the work. To reach beyond zero, the producer must surpass the consumer’s expectations, and the extra compensation manifests itself in the privilege of maintaining an excellent business relationship that will bring future rewards.
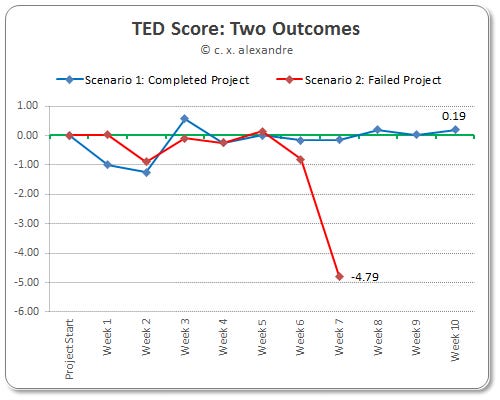
Figure 4 shows the progression of a completed and a failed project from start to finish over a 10 week period. Notice where the TED Score for Scenario 1 drops from the initial 0.00 to -1.00 at the end of Week 1. The consumer checked on the status of the project and was informed that the producer elected to do nothing -- no resource usage or deliverables built. The mere lapse of time lowered the value of the project. Scenario 1 reaches completion with a value of 0.19 exceeding expectations although it took until Week 3 to surpass the 0.00 baseline. The initial 4 weeks show a roller coaster of opposite values indicating that issues were detected on all fronts. On Week 8 the project stabilized and reached completion.
Another project is shown as Scenario 2, but with an unhappy ending. The TED Score abruptly drops to -4.79 on Week 7 when Week 6 indicated that expectations were slightly below the norm, matching the score during Week 2. The project encountered an insurmountable obstacle, and while the deliverables were close to completion, the product became useless and worthless. The magnitude of the drop in value is amplified by the varying importance levels that the consumer places on the three dimensions. Thus, the further away the value is from the baseline (0.00), the bigger the impact is on consumer satisfaction.
Parent/Child Relationship
While a project starts with no deliverable assets, budgets are allocated, and the clock is running the minute the contract is signed. As an example, we will use Project XYZ with three processes (actions not used here for simplicity) to illustrate the impact of a process within a project. The producer and consumer agree on a specification for a widget with 3 functions, a $10,000 budget, and a 10 week timeframe. The TED Score for the project can be calculated as a whole, based on the progression of each process as it contributes toward the completion of the Deliverables. In that case, the simple expression in Figure 2 will suffice.
However, the individual impact of every process on the project may underline the quality of the business relationship, depending on the consumer’s awareness and involvement at every stage. Although in both approaches the project was completed with the same end result, the negative TED Score derived from the process breakdown and using the composite expression as shown in Table 1, highlights a deficiency that should be addressed.
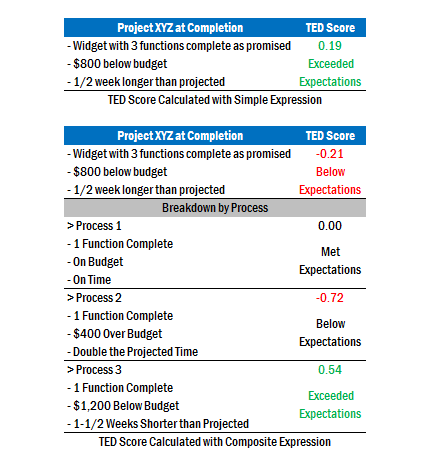
Furthermore, the consumer satisfaction level may appear optimal from the producer’s perspective, but a bad experience with Process 2 may have tilted the consumer’s bias toward seeking a new vendor for the next project. Although Process 3 truly picked up the pace in terms of budget and time, negative images are difficult to forget. The fact that the producer made up for lost ground in Process 2 may have been a result of increased pressure and consumption of the consumer’s time that is not reflected in the project’s own metrics. Furthermore, the producer has an opportunity to conduct a root cause analysis to prevent the issues in Process 2 from repeating in the future. Although the project was completed within guidelines from a top-down perspective, it is of the utmost importance to apply metrics at a lower level. In the absence of process and action metrics, troublesome inefficiencies will persist and remain undetected.
Consumer’s Priorities
Facing similar projects, various consumers will convey different priorities that are based on internal demands, financial conditions, and corporate culture, among other factors. Capturing those priorities is extremely important and is an integral part of the TED Score. In general, Deliverables is always the non-negotiable dimension, for it constitutes the very existence of the project. Consumer A may place a heavier level of importance on Timeliness that may be driven by internal factors, while showing less concern with Efficiency, if the environment is more forgiving on a little extra money for a worthwhile investment. On the other hand, Consumer B may be more adamant about Efficiency due to financial restraints and is willing to be more lenient on Timeliness in order to realize reduced costs. Yet, Consumer C views all dimensions with the same level of significance, and any variance will be a negative that will impact the TED Score dimensions equally. Gathering and communicating the consumer’s priorities is crucial in ensuring that the project’s progression and completion delivers the utmost satisfaction, while the producer’s definition of satisfaction is irrelevant to the consumer.
Internal vs. External TED Score
TED Score can be used simultaneously to measure actions, processes, and projects from an internal and external perspective. As an example, the efficiency component presents the producer with two views: cost to produce and revenue, and may highlight opportunities to gain a competitive edge. Thus far, the focus has been on the external consumer but the internal processes also benefit from TED Score. Identifying and quantifying ineffectiveness, presents the producer with the opportunity to reengineer business processes to achieve maximum profitability and competitiveness.
Be S.M.A.R.T.
TED Score is a different mind-set and highlights the importance of knowing the consumer’s requirements and, more importantly, the consumer’s priorities and preferences. That can only be accomplished through communication. The perfect TED Score has its roots on a clear understanding of Specifications, Metrics, Attainability, Resources, and Time.
(Original publication date: January 1, 2011)