

Gold is becoming the hot commodity again as global instability picks up, and we must dust up the study published in 2011 by the World Gold Council (WGC), titled “The impact of inflation and deflation on the case for gold.” It’s available at the organization’s website or you can download it here (pdf). The work was conducted by Oxford Economics and commissioned by the WGC, which is the equivalent of tobacco producers sponsoring a study about the benefits of cigarettes. Nevertheless, the report includes a baseline economic scenario and is summarized as follows.
- Steady economic recovery in major economies supported by strong emerging market growth.
- Easing of financial stress and repair of banking systems.
- Modest inflation, gradual normalization of monetary policy, slight dollar appreciation.
Below is the conclusion if the conditions above are met, although the criteria itself is somewhat vague.
As a result of these factors, gold underperforms other asset classes in this scenario from 2011-2015, with the best performing assets being equities and then cash. House prices are expected to recover only slowly while bonds perform relatively weakly due to the normalization of short-term interest rates.
The forecast was reasonable, but the cause behind the sudden drop in gold prices and decoupling from equity markets starting in 2013 is hard to pinpoint, even after considering currency and interest rate markets at the time, among other factors.
But the meat in the report is delivered when everything else is considered. Thus, under a deflationary scenario the commodity holds up quite well.
Gold is the number one performing asset until 2013 – despite a deflationary backdrop – and its performance over the whole 2011-2015 period compared to other asset classes is much better than in the baseline scenario. Cash, as might be expected, eventually turns out as the winner in this deflationary story with bonds also performing relatively well.
If stagflation is the future, then:
Overall, gold’s relative performance from 2011-2015 is better in this scenario than in the baseline, while lagging that in the deflation scenario. The big loser from 2011-2015 is bonds, while cash performs relatively well due to the adoption by central banks of a policy of high interest rates to combat inflation. This policy also bears down on equity prices which perform notably worse on a relative basis than in the baseline scenario.
If high inflation is the end result,
Gold outperforms all other asset classes in 2011-2015. Although house and share prices receive some initial support from the higher inflation environment, their performance stalls at the end of the scenario as recession ensues. Cash performs relatively poorly due to lax monetary policy and bonds perform badly, initially due to high inflation steepening the yield curve and subsequently to the delayed monetary tightening. Equities perform better than all other assets except gold.
Thus, unless the economy progressed according to the defined baseline, all other weather conditions were propitious to investing in gold. Fantastic! According to Oxford’s analysis, gold is always a great investment despite the extremely different economic monetary environments. Even under the baseline scenario, the key word is “underperforms,” leading the average investor to believe that it may still increase in value, although not as much as other assets.
But the more fascinating segment is found under “Modelling the price of gold,” where a somewhat invisible equation is introduced. Oxford Economics adds that “we experimented with a number of specifications incorporating the above factors and some others, but many were found not to add explanatory power and were dropped from the equation.” Then while some “useless” factors were surgically removed, others were added to capture “political disturbances,” as if the world has been free of those since 1980.
In addition to these variables we also found it necessary to include dummy variables for the last quarter of 1979 and the first two quarters of 1980 to improve the fit of the equation. These dummies aim to capture the major political disturbances of the period which were not fully picked up by other variables such as the default premium. The equation also passed the standard robustness tests, and the estimated price tracked the actual price relatively well over time.
Finally the chart below demonstrates how Oxford’s equation produced results that fit precisely with the price of gold since 1976.
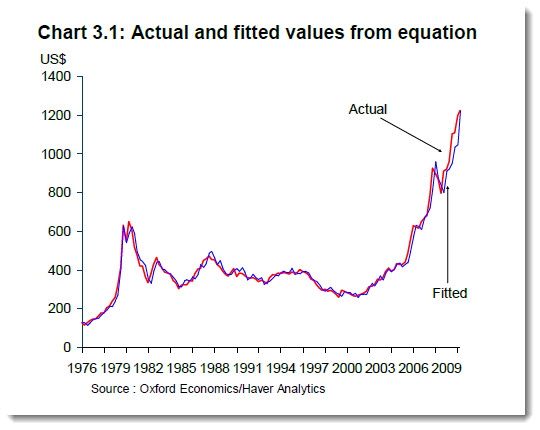
Mesmerizing, to say the least, and I’ve never had an out-of-body-experience with an equation that fits so perfectly, although it will provide fuel for those that yearn for a validation of any kind.
Lastly, the study “assumed that the gold price has an elasticity of one with respect to inflation in the long run, so that gold and the price level move together one-for-one over the very long term,” which has been proven incorrect, time and time again. I am not sure how that fits with the statement that “Gold is the number one performing asset until 2013” under a deflationary scenario.
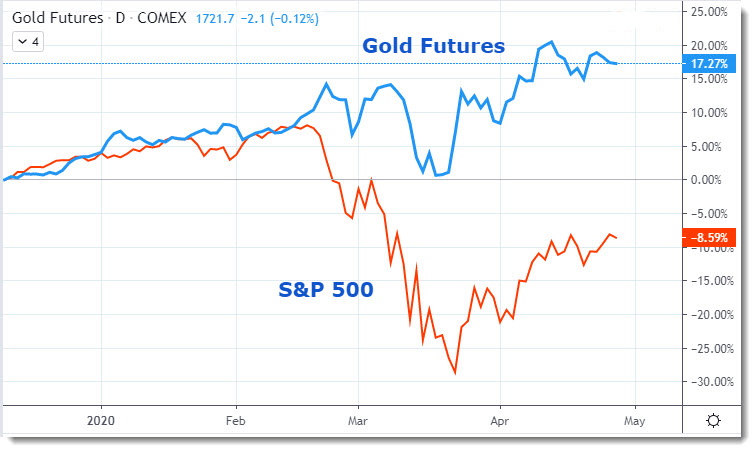
As the markets started to digest the current pandemic impact, gold price displayed the same rough pattern as the S&P 500 when it should have spiked in driven by fear and in search of safety.
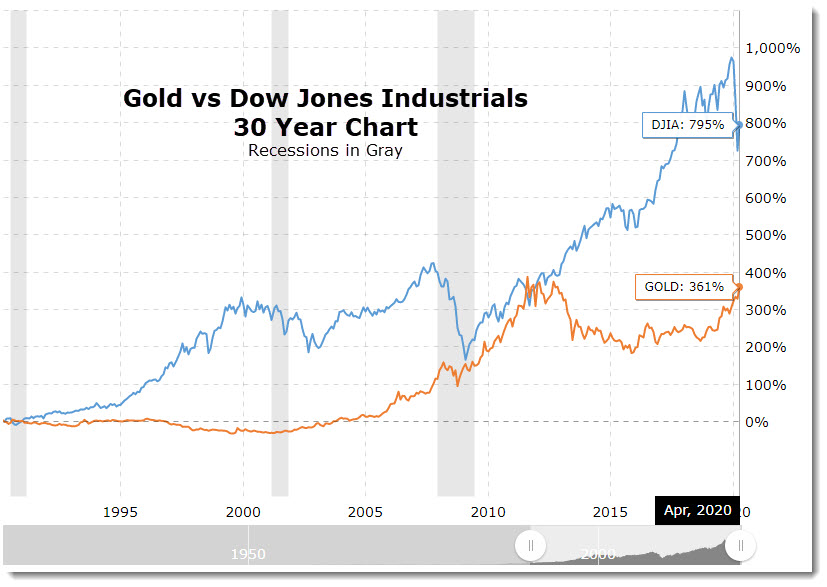
To add perspective to the subject, gold futures hit a record of $1,896.50 on Labor Day, September 5, 2011, the equivalent to $2,176 today after inflation. The Dow Jones Industrials closed at 11,139 the next day, translating to a current inflation adjusted value of 12,782. Now compare the inflation adjusted values of 2011 to today’s closing prices.
Every investment has its place in the sun from time to time, but nothing is absolute. Trading and investing is about interpreting aggregate market psychology and risk mitigation, not outdated fundamentals or over calculating all the letters in the Greek alphabet, and definitely not all weather magic potions that appeal to emotion.
